4 Maps That Sum Up Food In America
The future of the nations will depend on the manner of how they feed themselves, wrote the French epicurean Jean Anthelme Brillat-Savarin in 1826. Almost 200 years later, how nations feed themselves has gotten a lot more complicated. That’s particularly true in the US, where food insecurity coexists with an obesity crisis, where fast food is everywhere and farmer’s markets are spreading, where foodies have never had more power and McDonald’s has never had more locations, and where the possibility of a barbecue-based civil war is always near. Here are just 4 maps out of 40 to give you a glimpse of where our food comes from and how we eat it!
1. Obesity
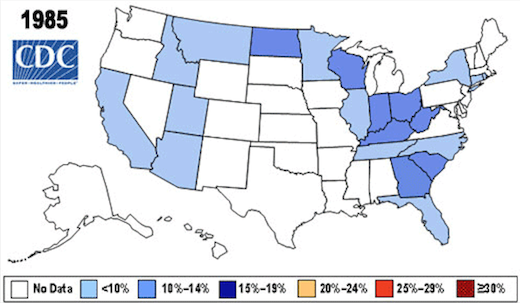
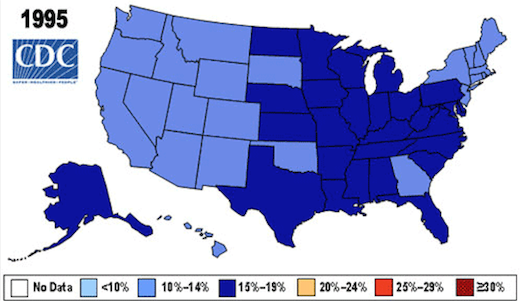
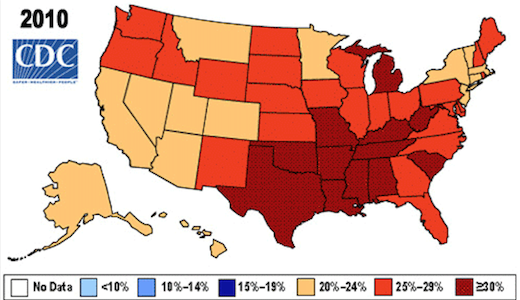
These maps show obesity rates since 1985. Many states were so unconcerned about obesity that they weren't even tracking it. Of those that were, none had an obesity rate higher than 14 percent. By 1994, all states had data, and the worst were 19 percent obese. And by 2010, 12 states reported that they were at least 30 percent obese. That's a doubling over the course of these maps! You can see that the obesity epidemic is especially bad in southern states, but this is truly a national problem.
2. Fruits And Vegetable Consumption
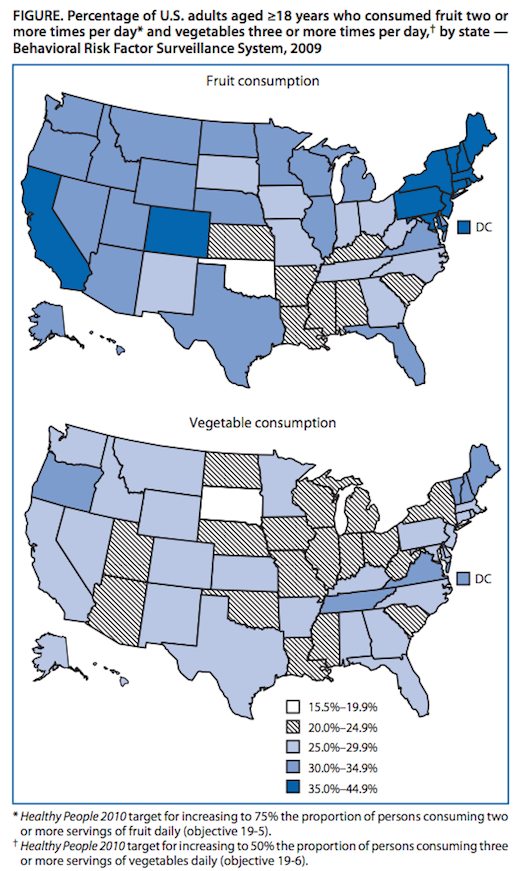
This data is from 2009, but it still shows interesting regional trends in who's eating their fruits and vegetables. The CDC suggests at least two servings of fruit and at least three servings of veggies a day. But its data shows every single state in the union is failing. Even in the areas that eat the more fruit — the Northeast, Colorado, and California — less than half the population is meeting the CDC's fruit goals. The situation for vegetables is even worse. Oregon, Tennessee, Virginia, and some New England states come out on top, but only 30 to 35 percent of their residents are meeting the CDC's vegetable goals.
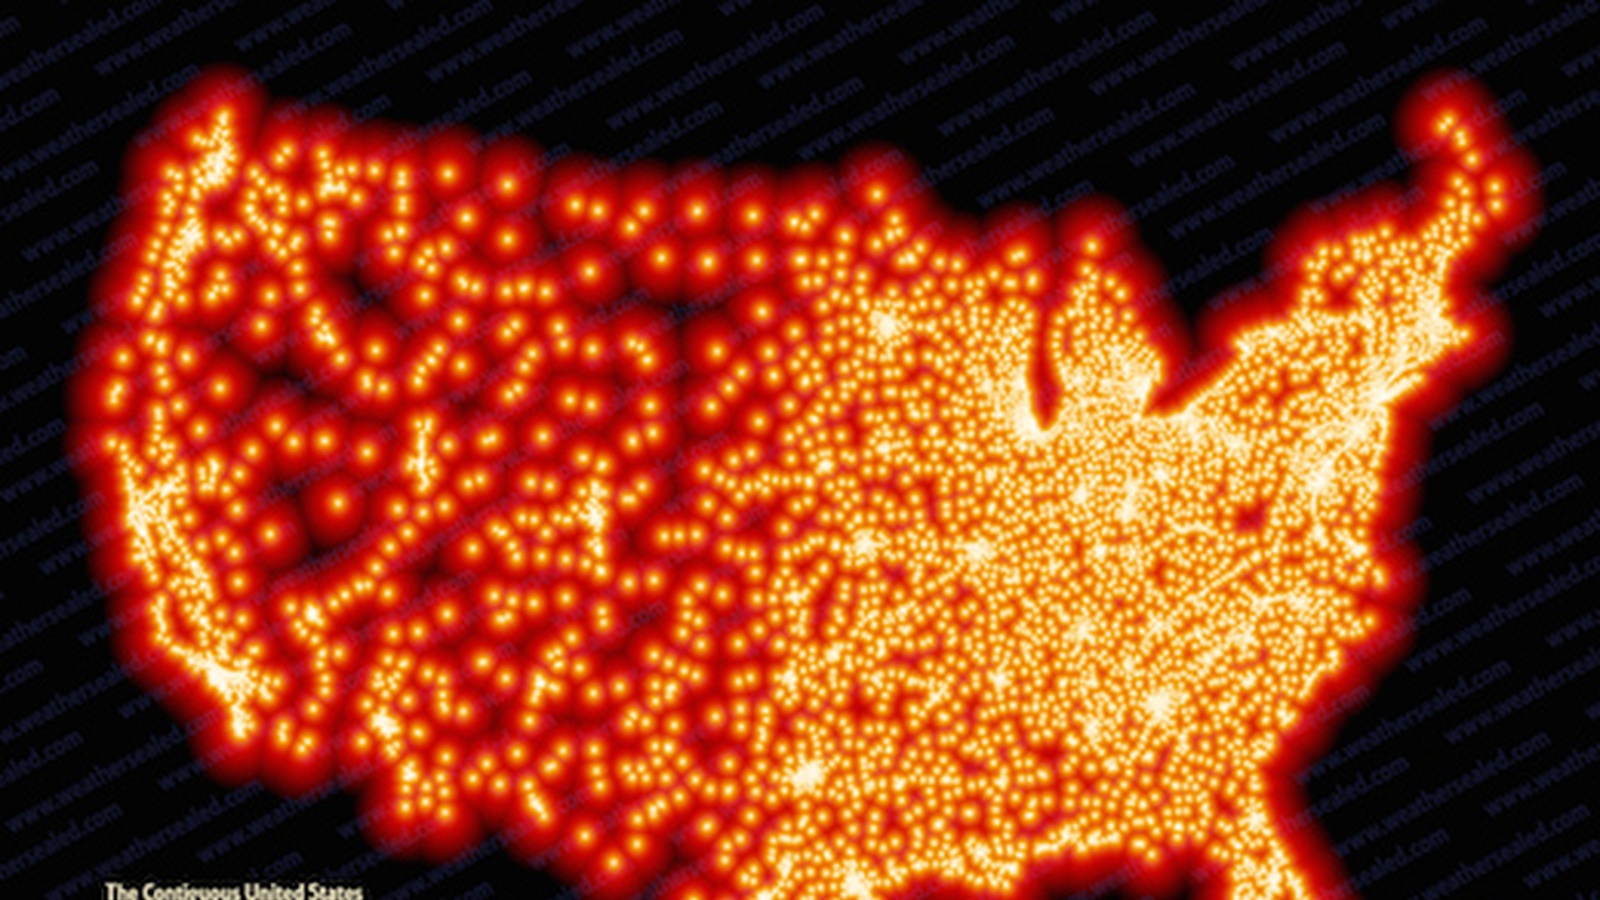
3. Distance From McDonald’s
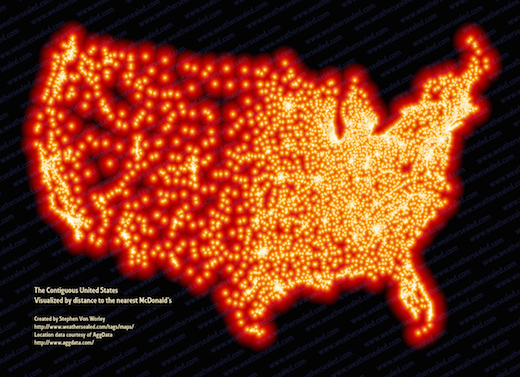
McDonald's has more than 35,000 locations on Earth, and the US has the highest concentration of them — about one for every 20,000 residents, according to The Guardian's Datablog. This map, by artist and scientist, Stephen Von Worley, shows the distance to the nearest McDonald's throughout the continental US. It doesn't look all that different from what the Earth looks like at night — the crowded East and West Coast, the spa
rsely populated areas west of the Rockies. And where is the "McFarthest Spot," as Von Worley puts it? Within that dark space in upper South Dakota, a 145-mile drive from the nearest Mickey D's.
4. Fast Food Restaurants Coverage
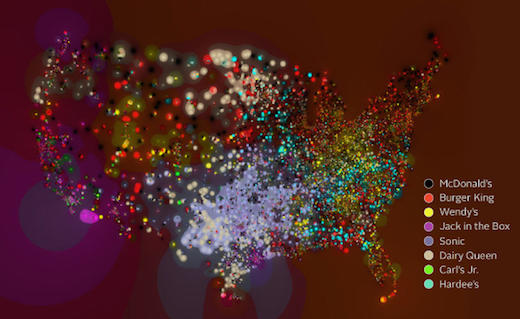
Stephen Von Worley's Beefspace map shows a country of fast food. Each point has the colors of the three most popular restaurants at that location. Black is McDonald's, so you can feel the relative influence of non-Mickey D's restaurants by the splashes of color. It's another example of the power of regional chains: look at the puddle of Sonic blue spilling out over the South.
Head here to see all 40 maps, graphs and charts from agriculture in 1992, to GMO’s and all things fast-food!
If you haven’t already, join our free global challenge at www.GetOffTheGluten.com to receive daily recipes & health tips, access to our private group for support and inspiration, plus before and after testing to track your progress in key areas of your life such as weight, sleep, bloating, skin-conditions, mental health and more!


James Colquhoun is the filmmaker behind Food Matters, Hungry For Change, and Transcendence Seasons 1 & 2 and founder of Food Matters and FMTV. Along with Laurentine ten Bosch, James founded the Food Matters community following the release of the 2008 documentary, giving people the tools (films, books, articles, and guided programs) to take charge of their own health. From here, FMTV was born! It was designed as a place where you can access vital information by watching all of your favorite inspiring documentaries, expert interviews, & recipe videos in one place, and in early 2020 FMTV found it's new home on Gaia.